Use Julia's array and control flow syntax in order to define the NxN Strang matrix:
$$ \left[\begin{array}{ccccc} -2 & 1\\ 1 & -2 & 1\\ & \ddots & \ddots & \ddots\\ & & \ddots & \ddots & 1\\ & & & 1 & -2 \end{array}\right] $$
i.e. a matrix with -2 on the diagonal, 1 on the off-diagonals, and 0 elsewere.
Using a for loop, write a function my_factorial(n) that computes the nth factorial. Try your function on integers like 15
Bonus: Use BigInt inputs like big(100). Make your function's output type match the input type for n. You'll know that you'll successfully matched the input type if your output does not "overflow" to negative, and you can check typeof(x). Hint, you may want to initialize a value using one(x), which is the value 1 in the type that matches x.
A random variable X~Bin(n,p) is defined the number of successes in n trials where each trial has a success probability p. For example, if Bin(10,0.5), then X is the number of coin flips that turn up heads in 10 flips.
Using only rand() (uniform random numbers), write a function binomial_rv(n,p) that produces one draw of Bin(n,p).
Use random number generation to estimate $\pi$. To do so, mentally draw the unit circle. It is encompassed in the square $[-1,1]\times[-1,1]$. The area of the circle is $\pi r^2 = \pi$. The area of the square is $4$. Thus if points are randomly taken evenly from $[-1,1]\times[-1,1]$, then the probability they land in the circle ($x^2 + y^2\leq 1$) is $\frac{\pi}{4}$. Use this to estimate $\pi$.
These problems integrate basic workflow tools to solve some standard data science and scientific computing problems.
An AR1 timeseries is defined by
$$ x_{t+1} = \alpha x_i + \epsilon_{t+1} $$
where $x_0 = 0$ and $t=0,\ldots,T$. The shocks ${\epsilon_t}$ are i.i.d. standard normal (N(0,1), given by randn()). Using $T=200$
use Plots.jl to plot a timecourse for each of the parameters. Label the lines for the values of $\alpha$ that generate them using the label argument in plot.
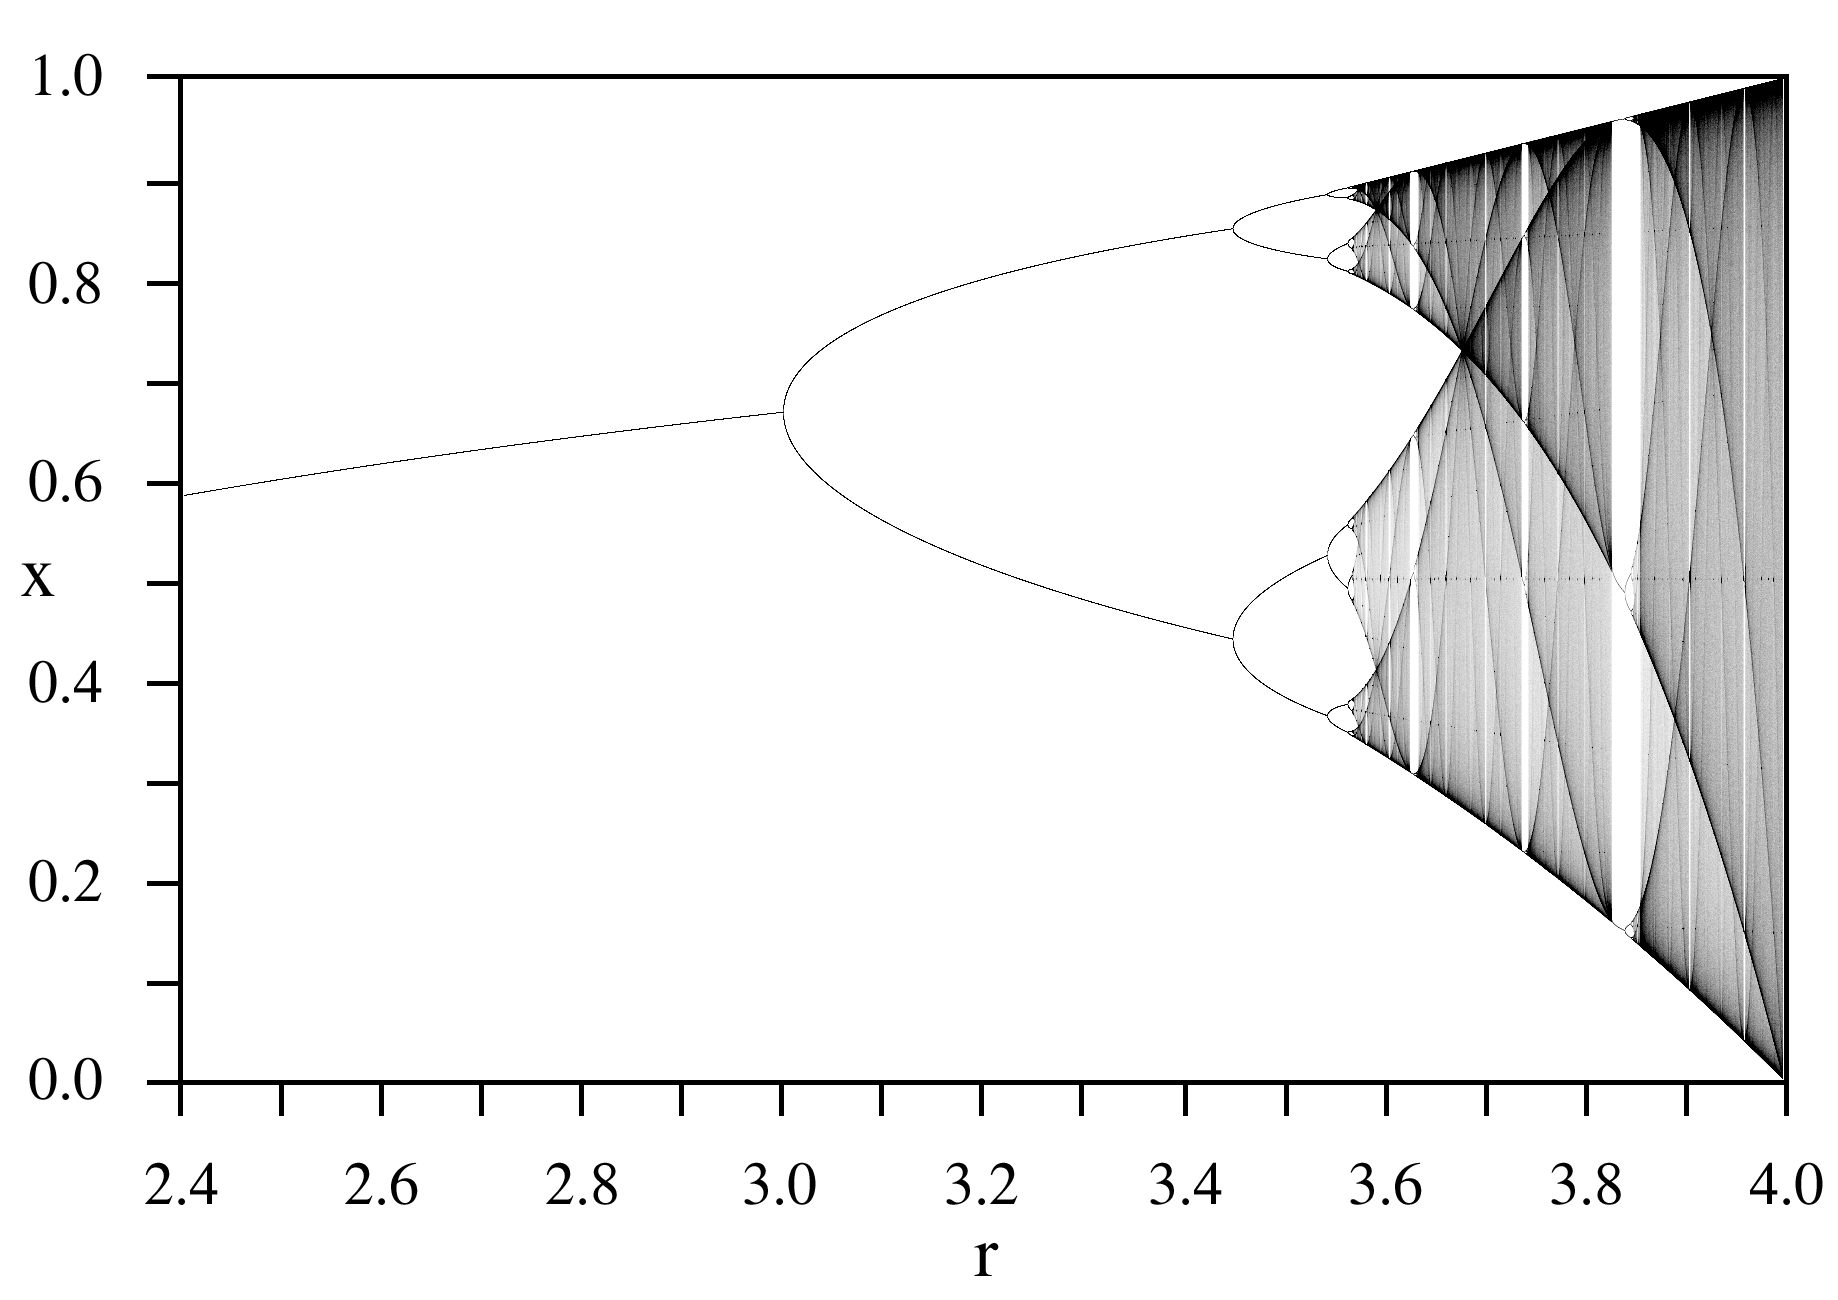
The logistic difference equation is defined by the recursion
$$ b_{n+1}=r*b_{n}(1-b_{n}) $$
where $b_{n}$ is the number of bunnies at time $n$. Starting with $b_{0}=.25$, by around $400$ iterations this will reach a steady state. This steady state (or steady periodic state) is dependent on $r$. Write a function which plots the steady state attractor. This is done as follows:
1) Solve for the steady state(s) for each given $r$ (i.e. iterate the relation 400 times).
2) Calculate "every state" in the steady state attractor. This means, at steady state (after the first 400 iterations), save the next 150 values. Call this set of values $y_s(r)$.
3) Do steps (1) and (2) with $r\in\left(2.9,4\right)$, dr=.001. Plot $r$ x-axis vs $y_s(r)$=value seen in the attractor) using Plots.jl. Your result should be the Logistic equation bifurcation diagram.